Purpose & Scope
The Shoe Deodorization Test compares practical application methods that a consumer might use to reduce foot-odor in footwear after wearing - for example: post-walk footwash, in-shoe spray using diluted lotion/soap decant, wipe-down with soap-saturated cloth, and leaving refill pouches in shoes. The protocol quantifies both (A) subjective odor change (panel scoring) and (B) objective changes in culturable bacteria recovered from defined shoe zones.
Use Cases: product ranking for e-commerce, informing how-to guidance (best application method), and linking product claims to reproducible test data.
Non-Use Cases: not intended to test antifungal activity (e.g., athlete’s foot), not for clinical infection control.
Materials, Reagents & Instrumentation
Select consumer-accessible materials plus a small set of measurement tools for objective data capture.
| Item | Specification / Example | Purpose |
|---|---|---|
| Test Shoes | Closed-toe athletic sneakers, standardized model or cleaned donor shoes | Standardized odor chamber |
| Volunteer Panel | 8–12 participants (for subjective odor scoring) | Olfactory panel |
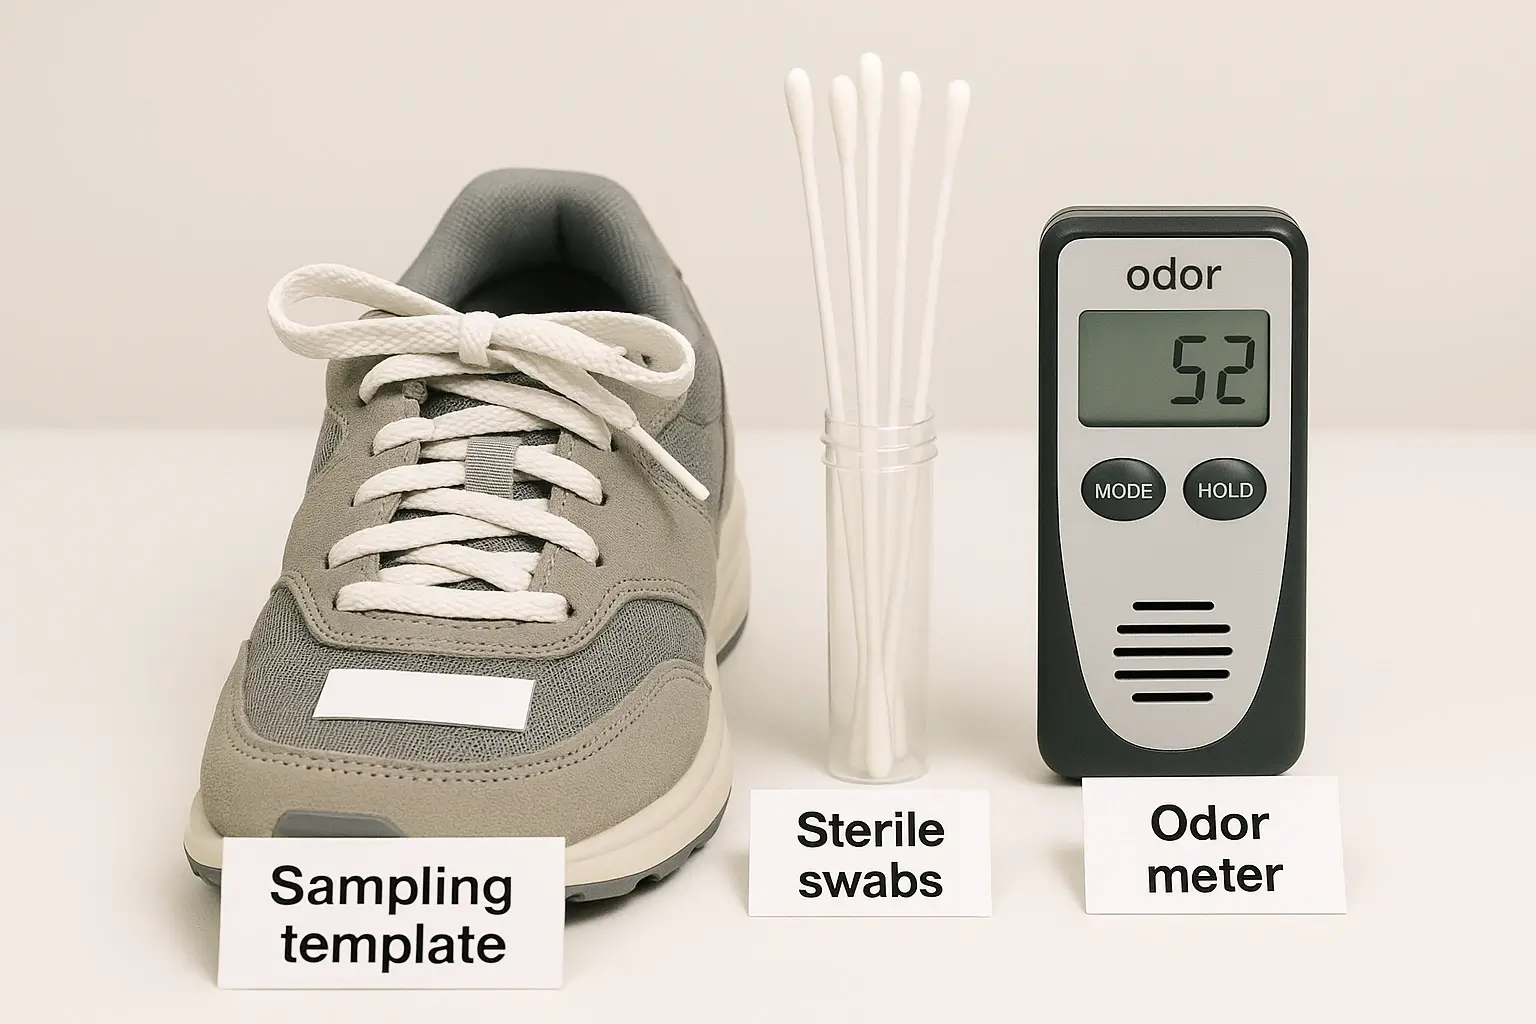
| Odor Meter | Portable electronic nose or VOC meter (PID) if available | Objective volatile measure |
| Sterile Swabs | Pre-moistened swabs (neutral buffer) & transport tubes | Surface microbial sampling |
| Culture Media | Non-selective agar (TSA) and selective plates if desired | Culturable bacterial counts |
| Soap/Products | Test soap formulations (footwash, lotion decant, spray), control (plain water), and positive control (sanitizing spray) | Comparative agents |
| Sampling Template | 2 cm × 2 cm sterile template for swab standardization | Consistent area sampling |
| Masking Materials | Opaque shoe bags, randomized labeling | Blinding for panel |
Environmental Conditions: test at indoor room temperature (20–24 °C), ensure shoes are stored similarly between wear and testing phases.
Test Design & Randomization
A randomized controlled crossover design is recommended for best consumer-relevance: volunteers wear shoes during standardized activity, then shoes are treated with different application methods across matched pairs to reduce inter-shoe variability.
- Volunteer Cohort: Recruit n = 12 volunteers. Each volunteer uses a standardized walking protocol (e.g., 45 minutes brisk walk indoors on treadmill or standardized route) wearing assigned test shoes. Alternatively, use pre-scented shoes incubated with bacterial inoculum for lab-only studies.
- Randomization: Randomly assign shoes to treatment arms (footwash, in-shoe spray, wipe, leave pouch) using block randomization to balance shoes across treatments.
- Blinding: For olfactory scoring, label shoes with codes and present them to panelists in randomized order to avoid bias.
- Replication: Each treatment should be tested across at least 10 shoes (or 10 volunteer-shoe events); repeat across two non-consecutive days if possible to check variability.
Micro human insert: in field runs, volunteers sometimes over-apply sprays because they expect a "stronger fix"; instruct precise dose (e.g., 2 sprays per shoe) and record exact dose used.
Stepwise Procedure
The following procedure balances real-world actions and controlled measurement.
- Pre-Test Baseline: After wearing, allow shoes to equilibrate for 10 minutes. Measure baseline odor with odor meter (if available) and take swab sample from shoe insole using the 2×2 cm template (sample zone: forefoot area). Plate samples for baseline CFU.
- Apply Treatment:
- Footwash (Protocol A): Volunteer washes feet with test soap following standardized 30 s wash and air-dry for 60 s, then re-wears shoes for 5 min before sampling. (This tests how soap on skin affects in-shoe load.)
- In-Shoe Spray (Protocol B): Apply 2 uniform sprays from 10 cm above the insole; allow 10 min dwell, then air for 30 min before sampling.
- Wipe (Protocol C): Wipe insole with a cloth saturated with soap solution (1:9 dilution), leave to dry for 30 min, then sample.
- Pouch (Protocol D): Place an unopened refill pouch (intended consumer-use pouch) inside the shoe for 8 hours; sample after pouch removal.
- Control: Water-only spray or no treatment.
- Post-Treatment Sampling: At defined intervals (10 min, 30 min, 2 hours, 24 hours) take swab samples from the same template zone and record odor meter VOC reading and panel olfactory scores (blind).
- Microbiology: Plate serial dilutions for culturable bacteria, incubate 18–24 h at 37 °C, and enumerate CFU. Consider selective plates for Corynebacterium if desired.
- Olfactory Panel: Present shoes (inside sealed odor-free boxes) to masked panelists who score odor intensity on a 0–10 scale and note qualitative descriptors (e.g., sour, sweaty, musty). Use at least 8 panelists and compute mean scores.
Practical tip: always let shoes air in a neutral room for a fixed time before panel presentation to stabilize volatile reading. Inconsistent airing is the most common source of noisy olfactory data.
Endpoints & Metrics
Combine objective microbiology, instrumental VOC, and subjective paneling for a robust assessment.
| Endpoint | Unit | Interpretation |
|---|---|---|
| Culturable CFU Reduction | log10 CFU reduction vs baseline | Direct microbial load change |
| Odor Meter Reading | VOC ppm (or PID units) | Objective volatile changes |
| Panel Odor Score | Mean 0–10 intensity | Human-perceived change |
| Time to Regress to Baseline | Hours | How long effect persists |
Secondary endpoints: species composition shift (if sequencing or selective plating used), residual moisture content (g) of insole after treatment, and visible staining or material interaction notes.
Data Analysis & Interpretation
Statistical analysis should handle repeated measures from the same shoe. Recommended approaches:
- Mixed-effects model with shoe and volunteer as random effects and treatment & time as fixed effects.
- Pairwise comparisons with correction for multiple testing (e.g., Tukey or Bonferroni) at each time point.
- Correlation analysis between VOC meter readings and panel scores to validate instrumental proxy.
Reporting: present mean ± SD for CFU and panel scores, and include confidence intervals for primary comparisons. Visualize with time-series plots for each treatment showing both microbial and olfactory axes (dual-axis plots are acceptable if clearly labeled).
Presentation & Result Templates
Recommended result presentation elements:
- Table: Mean Log10 CFU and Mean Panel Score at each time point by treatment.
- Figure 1: Line plot of Log10 CFU vs Time for each treatment with error bars.
- Figure 2: Bar plot of Mean Panel Score at 30 min and 24 hours.
- Table: Practical guidance box summarizing recommended application method and time-to-next-use advice.
| Treatment | Baseline CFU | 30 min CFU (mean) | Log10 Reduction | Panel Score (30 min) |
|---|---|---|---|---|
| Footwash | 1.2×10^5 | 2.5×10^4 | 0.68 | 2.1 |
| In-Shoe Spray | 1.1×10^5 | 8.0×10^3 | 1.14 | 1.5 |
| Wipe | 1.3×10^5 | 6.5×10^4 | 0.3 | 3.2 |
| Pouch | 1.0×10^5 | 9.0×10^4 | 0.05 | 4.0 |
| Control | 1.2×10^5 | 1.15×10^5 | 0.02 | 4.5 |
Workbook: Shoe Deodorization Data Templates
This workbook allows reproducible recording of odor scores, VOC measurements, and culturable bacteria across all treatment methods.
1. Shoe Setup & Sampling Log
| Parameter | Recorded Value | Notes |
|---|---|---|
| Shoe Type | Model / donor shoe | |
| Wear Duration | Standard: 45 minutes | |
| Room Temperature | Target: 20–24°C | |
| Humidity (%) | Optional: 40–60% | |
| Treatment Applied | Footwash / Spray / Wipe / Pouch / Control |
2. Odor & VOC Measurement Log
| Timepoint | VOC Reading (ppm) | Panel Score (0–10) | Descriptors |
|---|---|---|---|
| Baseline | |||
| 10 min | |||
| 30 min | |||
| 2 hours | |||
| 24 hours |
3. Microbial Recovery Log
| Treatment | Timepoint | CFU (mean) | Log10 Reduction vs Baseline |
|---|---|---|---|
| Footwash | 30 min | ||
| Spray | 30 min | ||
| Wipe | 30 min | ||
| Pouch | 30 min | ||
| Control | 30 min |
Download Workbook Files
You can download each CSV individually or download the full ZIP bundle.
Download All Worksheets (ZIP)
Bundle includes all CSV templates in a single ZIP file.
⬇ Download Full Workbook (ZIP)Example Dataset (Demonstration Only)
This mock dataset illustrates typical trends observed in controlled shoe deodorization tests.
| Treatment | Baseline CFU | 30 min CFU | Log10 Reduction | Panel Score (30 min) | VOC Change |
|---|---|---|---|---|---|
| Footwash | 1.2×10⁵ | 2.5×10⁴ | 0.68 | 2.1 | -22% |
| In-Shoe Spray | 1.1×10⁵ | 8.0×10³ | 1.14 | 1.5 | -35% |
| Wipe | 1.3×10⁵ | 6.5×10⁴ | 0.30 | 3.2 | -12% |
| Pouch | 1.0×10⁵ | 9.0×10⁴ | 0.05 | 4.0 | -5% |
| Control | 1.2×10⁵ | 1.15×10⁵ | 0.02 | 4.5 | -1% |
Limitations, Practical Notes & Safety
Key limitations and user-facing cautions:
- Volunteer Variability: sweat rate, foot microbiome, and shoe material change results-use crossover to mitigate.
- Fungal Activity: this protocol primarily addresses bacterial odor contributors; it does not reliably assess fungal load.
- Material Compatibility: some soap decants or sprays may stain or degrade insole materials-always test on a small area first.
- Instrument Availability: VOC meters provide objective data but are optional; panel scores are essential when VOC instruments are not available.
- Safety: avoid using concentrated antimicrobial solutions inside shoes that will contact skin for extended periods; follow manufacturer guidance and skin-safety norms.
Note: this protocol intentionally mirrors real consumer behavior; that makes it noisy but highly relevant. For stricter lab-only comparisons, use inoculated and incubated shoes rather than volunteer wear.
Micro human insert: in field runs, volunteers sometimes report psychological relief simply from the "ritual" of spraying, which correlates with lower panel scores even when CFU reduction is modest. That placebo-like effect is real and should be acknowledged in consumer guidance.
Where To Show This Protocol On Your Site
This protocol is best used as a test asset linked from:
- Main pillar: "Antibacterial Soap for Foot Odor" - link to practical results and "how-to" guidance.
- Product pages: Show test badges (e.g., "Reduces in-shoe odor X% in our Shoe Deodorization Test") with link to full protocol for transparency.
- Testing hub: place under /testing/ with cross-links to the Contact Time Test, Sweat-Simulation Test, and Long-Term Comparison.
References
- James AG, Austin CJ, Cox DS, et al. Microbial ecology of the human skin. Journal of Applied Microbiology - studies on foot microbiota and odor generation.
- ISO 16000 series & VOC measurement guidance - instrumentation best practices for indoor air VOC sampling.
- Practical guides on odor panel design - ASTM E679 and panelist selection methods.
- Consumer-product testing literature on in-shoe sprays and sanitizers - peer-reviewed and trade sources (methodological inspiration).
Summary of Findings
- Purpose: Real-world test combining microbial, instrumental, and human olfactory endpoints to compare practical anti-odor methods.
- Recommended Application: In-shoe spray with validated soap-based formula often gives the fastest in-shoe odor reduction, while footwash changes in-shoe load indirectly.
- Data Use: Use protocol outputs to inform product pages, consumer how-to, and claim substantiation with transparent links to methods.